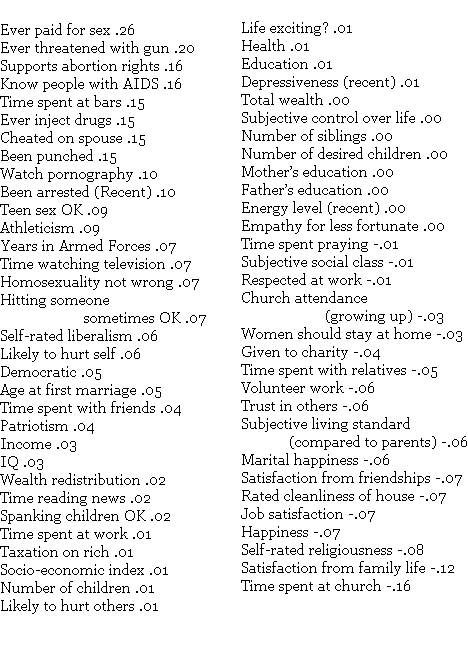
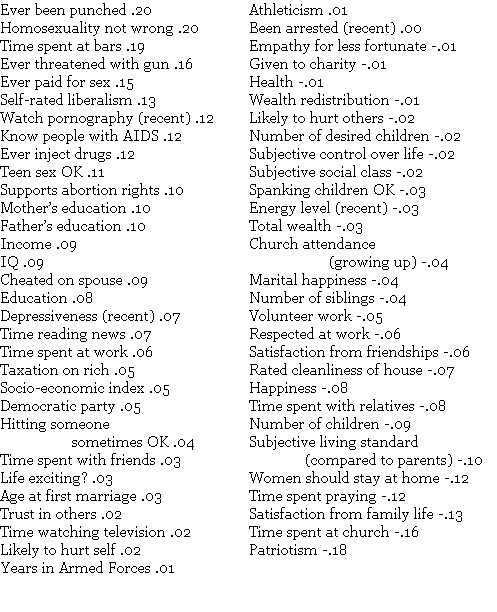
Tyler Cowen asks: What variable best predicts your number of sex partners? My answer, which I stand by, was that it’s the same variable that best predicts your number of tennis partners, your number of checkers partners, and your number of visits to Disneyland — namely preferences. But Jason Malloy of Gene Expression steps in with something a little more empirically verifiable. Drawing on data from the respected General Social Survey, he’s correlated number of partners with everything from patriotism to empathy to “ever been punched” (all self-reported), and has invited me to share his results with you. Number of sex partners (also self-reported) is defined as number of partners since your 18th birthday. Jason’s calculations are restricted to heterosexual couplings. A negative number means that that a high response to the variable predicts fewer sex partners and a positive number means that a high response predicts more.
The most promiscuous men are those who have paid for sex, been threatened with a gun, support abortion rights and know people with AIDS. The least promiscuous are those who spend time at church and report high satisfaction from family life. The most promiscuous women are those who have been punched, believe homosexuality is not wrong, and spend time in bars. The least promiscuous women are those who are patriotic and spend time in church. Here are the details. You tell me what you make of them.
(The second of these lists was edited, 10:20AM EST, to correct transcription errors mentioned by Jason in comments)


I am very surprised that near the end of the second list, nestled in with the traditional conservative views that are most negatively correlated with number of sex partners for women (“women should stay at home”, “time spent praying”, “self-rated religiousness”, “time spent at church”, “patriotism”), is “self-rated liberalism”. I would have guessed that to be positively correlated with number of sex partners (especially self-reported number of sex partners, i.e. the number you’re willing to admit to), the way it is for men.
Bennet, good observation. It’s possible that variable is being influenced by another (ie. years of education), right? I mean, the reason why we find it strange is that we are subconsciously thinking of two women that are equal in every way except for “self-rated liberalism”: but that may not be the case. Those two populations could have very different distributions. This was done as a simple regression, right?
Just noticed there is an “education” variable actually. My more general point could still stand though: maybe those women tend to work in academia. Those look like pretty asexual people. eheh Or maybe there’s a lot of lesbianism within the “self-rated liberal” women population, which would explain why those women report few male partners. :P
Fascinating results.
I notice for women, both “depressiveness” and “watching the news” are rated fairly high. It’s been shown in other stories that watching the news is correlated with depressiveness. I’d be interested to see what happens to the significance of factors once such correlations have been accounted for.
That was a transcription error on my part, Bennett. The liberalism correlation should be positive. Also the entry that says ‘Given to charity -.05’ on the female chart should read ‘Volunteer work’. (A disadvantage of blog comments is I can’t fix my errors after I hit post.)
It’s noteworthy that 6 of the top 10 correlates overlap for men and women:
Satisfaction from family life
Ever been punched
Time spent at bars
Time spent at church
Ever threatened with gun
Ever paid for sex
(GSS variable codes: SATFAM, HIT, SOCBAR, ATTEND, GUN, EVPAIDSX)
What do the numbers mean? Are they expected arithmetic increases? Expected geometric increases (plus 1)? Correlation coefficients?
As noted there are doubtless clusters and corelations within the variables. How many I wonder can stand as good and fairly direct proxies for preferences? At a guess “satisfaction with family life”, voluntarily listen to priests and preachers (attend church) and a few others seem good candidates. Some seem more related to choices made about the company one keeps — threatened with a gun, punched, know people with AIDS. I bet ANOVA will show some very distinct populations.
The liberalism thing for women is a bit surprising. One would think that liberalism would be positively corellated with, for example, education, acceptance of homosexuality, support of democratic party and others, all of which have positive effects.
For men, parents’ education, education and IQ have no or little effect. For women, all have fairly strong positive efects. This is the opposite of the idea of poorly educated women having lots of partners.
Women seem to find it patriotic to stay home with hubby, whereas men seem to find it patriotic to put it about a bit. I find it surprising that patriotism is the strongest negative factor for women.
We must not get confused with number of sexual partners and sex drive or sexual satisfaction. Also “positive” used entirely to mean positive correlation.
If you read the data as a “propensity to be a little slutty” rather than a “number of partners” list, I think it’s easier to understand why things match up the way they do. Please don’t associate my use of the word “slutty” as the common negative connotation, but I feel like it’s more descriptive than “number of partners” since we all have a finite amount of time for which to have sex after 18, and if we choose to have more partners than others, chances are it’s because we’re a little bit slutty (and that can be good and bad).
The list is somewhat unsurprising for the most part (albeit fascinating still), but what really stands out for me is that girls with educated parents are a little sluttier. At first I thought this went against the old “daddy issues” jokes, but then I realized that the higher the education level, the more likely that person is to be gainfully employed and thus busy at work.
On a side note, my new pick-up line is going to be “so… have you ever been punched?”
@Harold
This highlights one of my complaints about such social science numbers. What is measured is not partriotism but *electing to describe yourself as patriotic* on the survey. Here’s a possibility: patriotsim is seen as an old-fashioned virtue so will not be claimed except by those wishing to be seen as having old-fashioned virtues. This is emphatically not the same thing as being patriotic.
Polls also show that men report having three times as much sex as women. This means that the effect of lying is stronger than any variable listed.
Do patriotic women have sex with less people, or do they lie about it more? The data gives us every reason to ask the question, and no good way to answer it.
*correction
Three times as many sexual partners, not three times as much sex.
Another idea about the Liberal women, is that they may be viewing themselves relative to only their community as opposed to the nation as a whole. Women form highly conservative areas may view themselves as moderately liberal in comparison to their surroundings. i.e. A women who thinks she is liberal for taking a survey which asks about number of sex partners, coming from a more conservative town. Just a thought. I think this all falls under the broader category of “All things that make survey data unreliable”
Conclusion: if a woman won’t put out, punch her.
As Jeffrey points out, there is a mathematical inconsistency in the results reported in many surveys. The average number of heterosexual partners reported by men is usually much higher than the average number of heterosexual partners reported by women. This is possible if the number of women is much larger than the number of men. However, since that is not the case, it either indicates that the samples are not representative or that people lie a lot, even on a confidential survey. I’m inclined to believe that these results are about what stories people would like to tell rather than what people actually do.
Since people report inconsistent results without mentioning the inconsistency, it also means that the level of mathematical competency in those collecting the data may be low.
“As Jeffrey points out, there is a mathematical inconsistency in the results reported in many surveys. The average number of heterosexual partners reported by men is usually much higher than the average number of heterosexual partners reported by women… it either indicates that the samples are not representative or that people lie a lot, even on a confidential survey.”
Prostitutes, folks! How many prostitutes are filling out these surveys? I suspect not many, and, if that is so, then you have a small number of women having sex with one or two thousand men a year, accounting for the rest of the discrepancy.
The results are all from self-reported numbers. Does one type lie (feel the need to) more than another? What is the probability that a type will lie?