Monthly Archive for July, 2012

The Numbers Racket

If you’re the sort of person who reads economics blogs, you’ve probably heard that the median US worker has enjoyed hardly any income gain over the past few decades. Here are the numbers behind the noise (all corrected for inflation):

A mere 3% increase over 25 years does indeed look pretty grim. And note that the year 2005 is pre-crash, so what we’re seeing is not an artifact of the recession.

Now let’s look a little deeper and ask which demographic groups account for all this stagnation. White men? Nope, their median income is up 15%. Nonwhite men? Up 16%. White women? Up 75%. Non-white women? Up 62%. That’s everybody:

What gives? How can the median income shoot up in every demographic sector while the overall median remains nearly unchanged?

Continue reading ‘The Numbers Racket’

Share

Uncle Ezra’s Crazy Housing Plan

Ezra Klein at the Washington Post offers a way out of the current mess:

Tomorrow morning, Bernanke could walk in front of a camera and announce that the Federal Reserve intends to begin buying huge numbers of mortgage-backed securities with the simple intention of bringing the interest rate on a 30-year mortgage down to about 2.5 percent and holding it there for one year, and one year only.

The message would be clear: If you have any intention of ever buying a house, the next 12 months is the time to do it. This is Uncle Ben’s Crazy Housing Sale, and you’d be crazy to miss it.

Now, financial markets are not my specialty, and maybe Klein has thought about this more deeply than I have, but there seems to be a little flaw in this plan.

Continue reading ‘Uncle Ezra’s Crazy Housing Plan’

Share

Faces of Evil

On the left, James Holmes, who shot over 70 people and killed at least 12 in an Aurora, Colorado movie theater.

On the right, Torrence Brown, who was present in the theater (though not injured) and is reportedly preparing lawsuits against:

  • The theater
  • Holmes’s doctors (for “prescribing medication”)
  • Warner Brothers (because the movie that Torrence Brown elected to watch, and that James Holmes had never seen, was “too violent”)

Of course the scale of evil tips sharply to the left. But there’s plenty of evil to go around.

Click here to comment or read others’ comments.

Share

Mitt Romney vs. Joe Paterno

What do Mitt Romney and Joe Paterno have in common? They both devoted substantial fractions of their careers to promoting wasteful competition — Romney at the Olympics, and Paterno at the Penn State football program. How do Mitt Romney and Joe Paterno differ? Romney, unlike Paterno, devote a substantial fraction of his career to promoting healthy competition at Bain Capital.

To understand what’s wasteful about Penn State football, think about what life will be like now that the program’s been eviscerated. The overall quality of college football will decrease — but not by much. Any titles Penn State might have won, someone else will win instead, and the games leading up to those titles will be almost as fun to watch. But Penn State has reaped enormous rewards over the decades in exchange for its relatively small contribution to the quality of college football — and has plowed a substantial fraction of those rewards back into the program in order to maintain the flow of revenue. In short, Penn State football has sucked up a lot of resources while providing relatively little in return.

Continue reading ‘Mitt Romney vs. Joe Paterno’

Share

Late Night Thoughts on Determinism

Last week, we had some discussion of free will, which prompted some comments about determinism. I’m not convinced that determinism has all that much to do with free will one way or the other, but since the topic’s been raised, here are a few bullet points, jotted down late at night, which I hope will still make sense in the morning.

Continue reading ‘Late Night Thoughts on Determinism’

Share

The Wrong Tool for the Job

Paul Krugman, defending the IS-LM (a/k/a “old Keynesian”) model of the macroeconomy as a non-rigorous but useful “scratchpad”, misses the point by a mile:

It’s a simplified model that more or less gets at what you think are the essentials of an issue, and is easy to work with, so you can use it to reach quick first-pass judgments about policy or whatever.

………

But IS-LM isn’t the prime example of a scratchpad. What is?

The answer is, supply and demand.

It is not easy to derive supply and demand curves for an individual good from general equilibrium with rational consumers blah blah. And it’s definitely not easy to justify consumer and producer surplus as measures of welfare. And there have always been some purists who condemn any use of the S and D curves we all grew up with, the use of triangles to measure welfare loss, and all that.

But for the most part nobody pays attention. The supply-and-demand framework is so convenient, while pretty much getting at what you want to get at, that it’s what almost everyone uses to get a first-pass analysis of economic issues.

Okay, look. Supply and demand (and, especially, triangles of welfare loss, etc) are not entirely rigorous, but they’re good useful simplifications that actually give useful (though approximate) answers to important policy questions. Sort of like Ohm’s Law for electrical circuits.

But IS-LM is not like that at all, because IS-LM does not even address the key policy questions in macroecomics. IS-LM can tell you, perhaps, how to fight a recession, but it can’t tell you whether the recession is worth fighting — not even loosely, because the model contains no individual utility functions and no social welfare function. It therefore does not allow you even to formulate the question of whether a given policy is worth its costs, because it provides no framework for weighing costs against benefits.

Continue reading ‘The Wrong Tool for the Job’

Share

Free to Choose

The subject of free will came up earlier this week, and I notice that Sam Harris has a new book on the subject, which I have not yet read. Some of you have asked for me to elaborate on my remarks on this subject in The Big Questions. Here are a few bullet points:

Continue reading ‘Free to Choose’

Share

The Long Now

Here is a link to my piece in today’s issue of Time.com; and here’s the executive summary:

Deep inside a West Texas mountain, engineers are building a clock designed to click for 10,000 years. Amazon.com’s Jeff Bezos has sunk $43 million into this project and that’s just a start. What’s the purpose? “To foster long-term thinking and responsibility in the framework of the next 10,000 years”, say the organizers.

Now thinking and responsibility are two different things, but it’s hard to see how this project is likely to encourage either. Re thinking: The question of what we owe to future generations is subtle and difficult and requires close attention to difficult arguments; it’s hard to see how a ticking clock will do to foster that kind of effort. And as for responsiblity — if responsibility means making a better life for our distant descendants, then Bezos’s $43 million would almost surely be better spent on lobbying for lower capital taxes. Whether the goal is thinking or responsibility, a giant clock seems like a giant waste of time.

Click here to comment or read others’ comments.

Share

Charting the Tax Plans

Ezra Klein, quoted with approval by Paul Krugman, offers this chart of how the Obama and Romney tax proposals will change rates for taxpayers in various quintiles:

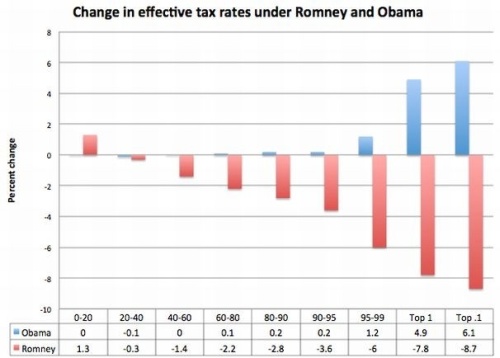
What we’re supposed to infer, according to Krugman, is that

we have an election in which one candidate is proposing a redistribution from the top … downward, mainly to lower-income workers, while the other is proposing a large redistribution from the poor and the middle class to the top.

But no such thing is remotely true. What we actually have is an election in which both candidates are proposing massive redistributions from the top downward, one slightly less so than the other. You’d never know this from looking at Klein’s chart because it illustrates changes in rates, whereas what actually matters is the rates themselves. It makes no sense to ask whether any particular group ought to be paying more or less without reference to how much they’re already paying.

Indeed, this is a classic example of what I once called the “Grandfather Fallacy” — by focusing on changes instead of absolutes, Klein’s chart conceals any existing inequities and hence treats them as “grandfathered in”.

Fortunately, Greg Mankiw has provided the numbers that allow us to make the requisite correction. Here, according to Mankiw, are the current tax burdens on various income groups (counting transfers as negative taxes, as of course one should):

Bottom quintile: -301 percent
Second quintile: -42 percent
Middle quintile: -5 percent
Fourth quintile: 10 percent
Highest quintile: 22 percent

Top one percent: 28 percent

That “-301 percent” means, for example, that a typical family in the bottom quintile receives $3.01 in net transfers for every $1 that it earns.

By adding these numbers to the numbers in Klein’s graph, we can construct a picture that actually depicts something interesting, namely the projected tax burdens for each group. It looks like this (the vertical axis represents percentage of income):

Note, for example, that, contrary to the impression you might have gotten from Klein’s and Krugman’s posts, both plans place the highest percentage burden on the top 1%, and both plans place a negative burden on the middle quintile — though Obama’s does both of these things to an ever-so-slightly greater extent than Romney’s does. There’s room for disagreement about which plan is fairer, but no room, I think, for disagreement about which chart is relevant.

Continue reading ‘Charting the Tax Plans’

Share

Chain Reaction

If you study economics, or statistics, or chemistry, or mathematical biology, or thermodynamics, you’re sure to encounter the notion of a Markov chain — a random process whose future depends probabilistically on the present, but not on the past. If you travel through New York City, randomly turning left or right at each corner, then you’re following a Markov process, because the probability that you’ll end up at Carnegie Hall depends on where you are now, not on how you got there.

But even if you work with Markov processes every day, you’re probably unaware of their origins in a dispute about free will, Christianity, and the Law of Large Numbers.

Continue reading ‘Chain Reaction’

Share

Goodnight to the Street Sweepers, Night Watchmen, Flame Keepers…

More great music, a propos of nothing in particular:

(YouTube version here.)

Click here to comment or read others’ comments.

Share

Disposable Thumbs

The average economist would sacrifice 1.02 years of life to avoid losing a thumb, or .77 years of life to get a paper published in the American Economic Review. An AER publication, then, is worth about 3/4 of a thumb.

We learn this from a study by three economists who sent out 1300 questionnaires, all to economists who had recently published in one of six major journals. They received 85 responses. Of these, 7 were discarded because they claimed to value their thumbs more than their entire hands, or their hands more than their entire arms, and another four were discarded because they indicated they were willing to sacrifice life-years for the privilege of losing a body part. The remaining 74 respondents valued their body parts as follows:

Continue reading ‘Disposable Thumbs’

Share

China Doll

China has one of the highest male-female sex ratios in the world; as I discuss in Chapter 17 of The Armchair Economist, that means women can afford to be picky. Here (as reported in the May 14 issue of The New Yorker) are the requirements listed by a female graduate student seeking a mate on the Chinese equivalent of match.com:

  • Never married
  • Masters degree or more
  • Not from Wuhan
  • No rural I.D. card
  • No only children
  • No smokers
  • No alcoholics
  • No gamblers
  • Taller than one hundred and seventy-two centimeters
  • More than a year of dating before marriage
  • Sporty
  • Parents who are still together
  • Annual salary over fifty thousand yuan
  • Between twenty-six and thirty-two years of age
  • Willing to guarantee eating at least four dinners at home per week
  • At least two ex-girlfriends but no more than four
  • No Virgos, no Capricorns.

Continue reading ‘China Doll’

Share

Tuesday Puzzle

There’s an old puzzle popular among a certain type of schoolchildren that challenges the solver to write as many positive integers as possible using exactly four 4’s, together with some set of mathematical operations. (As is often the case with school children, the exact rules tend to get negotiated in real time as the puzzle is being solved.) Some examples are:

But when I became a man, I put away childish things. So here’s the grown-up version of the problem, which I got from Mel Hochster over 20 years ago, and still don’t know how to solve:

This being a grown-up problem, the rules are carefully specified:

Continue reading ‘Tuesday Puzzle’

Share

New Math

It was obvious the police department was running an investigation that paralleled mine, the two interesecting at more than one point.

—Sue Grafton, V is for Vengeance

Click here to comment or read others’ comments.

Share