The most controversial and most widely debated topic ever covered on this blog began with a post called Are you smarter than Google, which spawned a series of followup posts with over 1000 comments (not counting the tripe I deleted), of which many are thoughtful, many are insightful and some are brilliant.
I’d have thought that after sixteen years there was nothing new to be said on this topic. I’d have been wrong. I’ve just received a marvelous email from reader Rui Viana, reproduced in full (with permission) herewith:
This is a follow-up to a sixteen-year-old debate on your blog. The question that started it all was: there is a certain country where everybody wants to have a son. Each couple therefore keeps having children until they have a boy, and then stops. What fraction of the population is female?
You pointed out that the correct answer is not 1/2, because, if I may paraphrase, 1/2 is the ratio of E(G) to E(B + G), whereas the question asks for E(G/(B + G)), which yields a different answer when the country has a finite number of families.
In this article, I analyze this and related questions, and provide two derivations of the expectation above. Here’s a short summary of the bijective proof, which is particularly clean and which I thought your readers would like to see.
The genders are inverted in the article: each family has children until the first girl, and we are interested in Pk: the expected proportion of boys as a function of the number of families k.
Here is the bijection. Concatenate the birth histories of all the families into a single string, and mark one of the children randomly. For example, an outcome with three families might look like this:
BBG | BG | BBBGwhere the underlined boy is the marked child. From the string, we can identify each family history by splitting it after each girl. The probability that the marked child is a boy is exactly Pk. If it is a boy, change it into a girl:
BBG | BG | BG | BGThere is now one extra girl and thus one extra family. This new string is a valid birth history for k + 1 families with a marked girl, subject to one additional condition: the marked girl must lie in one of the first k families. This operation is easily reversible: simply change such a marked girl back into a boy.
Because boys and girls are equally likely, changing one boy into one girl does not change the probability of the birth sequence. It also does not change the total number of children, so it does not change the probability with which that child is marked.
The probability that the marked child is a girl in the k + 1-family string is 1 − Pk+1, and each of the k + 1 girls is equally likely to have been marked. Hence the probability that she belongs to one of the first k families is k/(k + 1). This argument gives the following recurrence:
Pk
=
k
k + 1
(1 − Pk+1)
Applying the same identity to Pk+1, then to Pk+2, and so on, gives
Pk
=
kk + 1
−
kk + 2
+
kk + 3
−
kk + 4
+ ··· .
For one family, this converges to 1 − log 2 ≈ 0.307. As you observed all those years ago, for every finite k, Pk remains below 1/2 even though it approaches it from below as k goes to infinity (the limit calculation is left as an exercise to the reader).


A beautiful proof.
Oddly enough got into an instagram argument about this problem with someone a few months ago where my opponent insisted that the value was 1/2 for *every stopping rule*. Which is the usual (wrong) argument here. I ended up coming up with progressively simpler scenarios to disprove this.
The final case which I think might be maximally simple in some sense is: Imagine a one family country where the rule is “Stop after the first boy OR the second child”. The possible strings of children are B, GB and GG which occur with probability 1/2,1/4 and 1/4 respectively. The corresponding proportions of boys are 1, 1/2 and 0 giving an expected proportion of boys of 1*1/2 + 1/2*1/4+0*1/4 = 5/8 != 1/2.
I, too, thought we were finished with this puzzle, but apparently that is not the case. Your calculations and reasoning are exquisite. However, I question your – and Landsburg’s – interpretation of the original Google Puzzle. Do you really believe Google was asking for the average of fractions, which anyone knows would yield a different answer than the average of raw data?
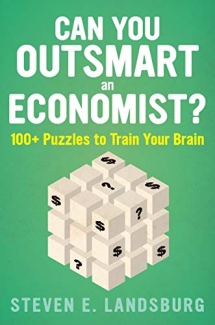
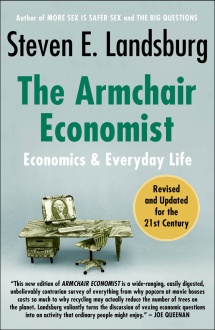
When I first read Can You Outsmart An Economist it took me a few minutes before I realized where Landsburg was going with his Google Puzzle argument, and then I wondered why was he doing that. I did not share his interpretation of the puzzle. But then again, I did not share many of his conclusions in Can You Outsmart An Economist. I found his arguments to be self-serving, oftentimes based on false equivalents, and in some cases just plain old bad math. In all fairness to Landsburg, I loved his book. I have purchased numerous copies which I gift to friends and associates.
I tend to view things in a more straight forward manner. Let’s say I have two baskets. One basket contains 50 apples, and the second basket contains 60 oranges. My conclusion is that the ratio of apples to oranges is 1:1, the fraction of apples is 1/2, and the percentage is 50 percent. Only Landsburg argue that my reasoning is incorrect based on whether I loaded the apples in to the basket two at a time or three at a time. See how crazy it can get?
Let me give you a real world example that I pulled directly from Landsburg. I work for a guy named Tony, who owns a diner. Tony came to me one day and said he was going to place his supplies order for the upcoming week, and he asked me to calculate his average egg and pancake usage from the previous week. Perfect, I thought. I pulled each breakfast order from the previous week, calculated the fraction of eggs to pancakes for each order, and then informed Tony of my findings. “The answer is 7/16” I said, very proud of myself. Tony fired me on the spot. Now all ai am qualified to do is teach Economics at a liberal arts college.
David Baker: The problem with your analysis is that:
a) the problem **specifically asks** what fraction of the population is female.
b) it is patently obvious that this question is unanswerable, because the fraction of the population that is female could be anything.
c) it is pretty standard practice that when your asked to predict a statistic that you cannot possibly predict with perfect accuracy, you are really being asked about (first) the expected value of that statistic and then (subsequently perhaps) some additional information such as the variance, skewness, etc. But certainly the expected value.
d) it is pretty much standard practice that if you are **explicitly asked** about one statistic and you respond by reporting on a different statistic, then you don’t get credit for answering the question.
If Tony asked you for the average egg and pancake usage over the past week, you should have added up all the eggs and all the pancakes and taken a ratio. If you said 7/16, you deserved to be fired. You gave him the wrong statistic. But if he had asked you for the average egg content of a given breakfast, you should have said “well, it varies from breakfast to breakfast, but on average, the answer is 7/16.” And if I ask you for the average fraction of girls in a given country, you should say “Well, it varies from country to country, but on average— well, on average the answer depends on the country size. It’s never 1/2, though”.
Steven,
Thank you for your reply.
Let me first apologize for the typos in my previous message. I was working from my android phone and it was a bit unwieldy.
You did an excellent job in defending your interpretation of the Google puzzle, and I accept it for what it is. Google should have been clearer if they expected and answer of 50 percent.
As for Tony and his diner, I was just kidding around with the story, although I find it interesting that you were very quick to catch on to what Tony needed to complete his supplies order, but not so with the Google puzzle, which has taken on a life of its own.
In the meantime, I began glancing through Can You Outsmart An Economist and I made it all the way to page 12, the Donuts puzzle, before I ran in to our first glitch. Neither of your answers is acceptable. All three of the friends, having read your book and being thoroughly convinced that HT comes up more often as a percentage as compared to HH, each of them wanted HT. An argument ensued. How can three guys who can’t figure out how to divide a donut be entrusted with deciding who should get HT and who should get HH? So that didn’t work. The second option does not work either. If the first two friends toss either H and then T, or T and then H, the third friend has already lost; his flip will just be to determine which of the first two friends wins. The best course is to have the odd-man-out eliminated, and the remaining two friends toss the coin and call heads or tails. I know this is minor, but, hey, the devil is in the details. Right? The donut puzzle was in the warm-up section of your book. There are some other puzzles later in your book that, I think, are very far off base, but would require a much longer explanation than what I provided here with regard to the Donut puzzle. I am not sure your level of interest, but I would be happy to send you my comments on the other puzzles if you have the interest. Thanks.
I guess Im missing something. So the number of kids until one has a boy is geometrically distributed and the expectation of that is 1/p. In this case thats 1/2. So each family in expectation has 2 kids with 1/2 probability that each is a boy?
Michael (#5): The expected number of kids per family is the sum of k/2^k, which is 2. Each kid has a 1/2 probability to be a boy. So you are right on both counts. The expected number of boys per family is therefore 1. So is the expected number of girls. The expected *fraction* of boys per family, however, is much less than 1/2 (about .307). Even more strikingly, the expected *ratio* of boys to girls is infinite, because some families will have zero girls (giving a ratio of infinity) and when you average those families with all the others, you average is sure to be infinite.