If you want to know why some countries are rich and others are poor, a good starting place is this graph, which I took from the first edition of David Weil‘s quite marvelous textbook on Economic Growth:
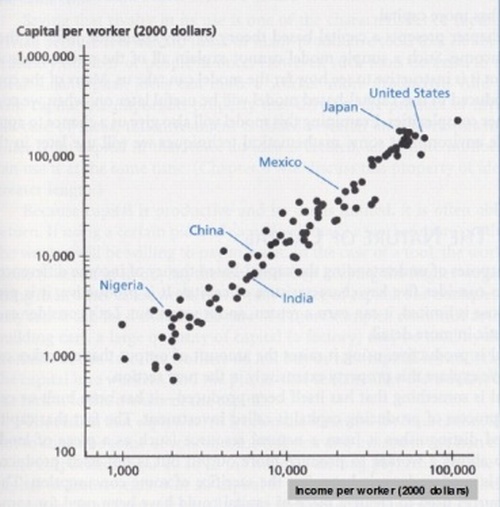
Because I took this from Weil’s first edition, these data are several years old, and some countries might have moved up or down the ladder since then. But the overall picture is clear: More capital per worker means more output per worker, and more output per worker means more income per worker. This relationship — in fact, the nearly linear relationship that you see on the graph — is just what standard economic theory predicts. It’s nice to see that prediction so powerfully confirmed.
Capital here refers to physical capital — the machinery, factory space and office equipment that allows workers to be more productive. A garment worker with a sewing machine produces more blouses per hour than a garment worker with a needle and thread; therefore the garment worker with a sewing machine earns higher wages. (A good rule of thumb is that workers are paid about 2/3 the value of what they produce.) If you want rich garment workers, you need a lot of high-quality sewing machines. If you want rich farm workers, you need a lot of high-quality tractors.
And if you want more high-quality tractors, you need more factories producing them — which means fewer factories producing consumer goods like, say, cars. That in turn requires consumers to rein in their immediate appetites, spending less and saving more. In other words, capital accumulation is driven in part by frugality. Forgo that car purchase and the factories will produce another tractor instead. That’s why tax policies matter. A tax that punishes saving (e.g. the estate tax) is a tax that encourages spending. Because of that tax, the rich buy more cars, the factories produce fewer tractors, and farm wages fall. If you doubt that farm wages depend heavily on the production of tractors, have another look at the graph.
Do not, however, jump to the conclusion that if, say, Nigerians had access to Japanese levels of capital, then Nigerian wages would rise to Japanese levels. Part of the reason Nigerians have so little capital is that capital is used less efficiently in Nigeria, so people choose to accumulate less of it. To move up this ladder, you need to do more than just accumulate capital — you’ve got to be the sort of country where capital is worth accumulating. What that entails will be a topic for a future post.


Steve,
Beautiful graph. First thing that springs to my mind is the circularity problem. Why does the higher wage not lead to a higher value of capital, rather than that a higher value of capital leads to a higher wage?
I am guessing it has something to do with that capital is traded internationally whilst labor domestically and your point that capital is valued more where it is used more efficiently?
There are three questions I have – first of all, can you prove that the estate tax leads to higher spending IN PRACTICE? Sure the assertion makes sense in theory, but (in particular when death is involved) human beings aren’t nearly as rational as economists conveniently assume for the sake of their models.
Secondly, is there any way of quantifying how large this effect is? Is it maybe so small as to be insignificant?
And thirdly – does the estate tax have any benefits?
What are the implications for the economy if capital accumulates in an extremely top-heavy fashion (which is to some degree countered by the estate tax)? Why do you think the negatives outweigh the positives?
There is evidence that high inequality leads to lower growth, after all.
http://www.economist.com/economics/by-invitation/guest-contributions/reducing_inequality_can_be_growth-enhancing
Bravo! The post of the year.
In other words, the only way to increase productivity is to increase your savings and reduce your consumption.
Do you think that a policy of printing money and lending it helps reach this objective or works against it?
I do not see a linear relationship, your units on the graph are in logs. This is also a cross sectional observation, so this does not tell us anything about capital accumulation or how a country’s growth rate of GDP depends on capital.
1. But if everyone’s saving, who’s buying the tractors?
2. But if people don’t buy cars, who will build car factories?
Martin-1: As I said in the last paragraph, you must not infer causality from this graph. What’s happening is that a) productivity affects both capital and income and b) capital affects income — so what you’re seeing here is partly due to the fact that capital and income have a joint cause (productivity) and partly due to the fact that capital affects income. I’ll try to sort all of that out in a post later this month.
Maurizio Colucci:
In other words, the only way to increase productivity is to increase your savings and reduce your consumption.
Do you think that a policy of printing money and lending it helps reach this objective or works against it?
Inflation discourages people from holding cash, but cash is not the only store of savings, so I doubt this is a big factor.
Except for your final paragraph, this post has a very Mises-esque flavor to it. Mises felt that savings (and therefore capital accumulation) were the only way to generate wealth in an economy.
I recall reading in the blogosphere a few weeks ago someone suggesting that poorer countries must first accumulate a lower level of capital before they can reap the gains of higher levels of capital. So, Nigeria would have to first “become China” in order to eventually “become Japan,” and so on. This makes intuitive sense to me, but I’ve never read a comprehensive analysis on the topic.
Steve –
This is more or less the subject of my research. What I found, looking at developing economies since 1980, is that those which tried to impel growth by accumulating large capital stocks mainly failed. Big investment, particularly when done using government funds after a commodity price boom, does not lead to take-off.
It’s certainly true that output growth and capital growth go hand-in-hand, but I’m strongly disposed to believe that both are led by a third cause.
My findings, of course, are not necessarily generalizable to developed economies.
Cool graph. Now to quibble:
1. Intrigued that Landsburg chose a graph focusing on physical capital but not human capital. Is human capital harder to measure? Less explanatory?
2. The graph is labeled “Capital per worker” and “Income per worker” – which I take to mean average capital per worker and average income per worker. I wonder how this graph would change if we looked at median levels of capital owned by worker, and median levels of income received by workers.
After all, a nation of slaves and slave owners might fit well on this graph – with high levels of “Capital per worker” corresponding with high levels of “Income per worker.” I’d be curious to hear what the workers at Foxconn think of Landsburg’s “good rule of thumb … that workers are paid about 2/3 the value of what they produce.”
3. I’m curious how “worker” is defined for purposes of this graph.
4. And, as ever, I’m curious about how “income” is defined. In particular, is the value of government services counted as income?
Hypothesis: Europe has higher level of taxation than the US, but uses these resources to invest in human capital (education, health care) at a government level. Weil excludes these benefits from measures of “income,” while including comparable income that US workers earn and spend for these purposes.
One thing that always confuses me is that one person’s consumption is by definition another person’s income. If people are not buying cars what incentive do I have to buy equipment to produce cars? Or take a more extreme example suppose everybody saves 100% of their income, then consumption will be 0, and no incentive to produce.
Salim Furth:
It’s certainly true that output growth and capital growth go hand-in-hand, but I’m strongly disposed to believe that both are led by a third cause.It’s certainly true that output growth and capital growth go hand-in-hand, but I’m strongly disposed to believe that both are led by a third cause.
I hope I did not imply otherwise! Total factor productivity, of course, drives both output growth and capital growth. This is exactly what I promised in my final paragraph to address in a future post.
I wish these numbers were normalized to the cost of land in the respective countries.
My hypothesis: both these numbers are proportional to cost of land.
(1) Wages: a worker is an economic entity whose main expenses are housing (proportional to local land costs), food (proportional to cost of agricultural land, again) and entertainment (again,…). In the presence of unemployment, wages for workers without unique skills can’t significantly exceed these expenses.
(2) Capital: “Capital here refers to physical capital — … factory space …”, which I suspect is the main component. (Again, it’s proportional to cost of land + cost of construction (wage), which is proportional to cost of land according to (1). Sewing machines and tractors are not that expensive compared to buildings and fields.
In response to nobody.really, the income per worker is about $70,000. Given that this is old-ish, that does not represent median income, which is about $45,000. I presume this is mean income.
Steve you wrote:
“Inflation discourages people from holding cash, but cash is not the only store of savings, so I doubt this is a big factor.”
Printing money sends a false signal to the market that there is more capital available than there actually is. Economic agents both increase their consumption and start on long term projects when society hasn’t accumulated enough capital to complete these projects (eg building a house that needs 100 bricks when there are only 80 bricks available) leading to their inevitable collapse.
By the way, what is that outlier with both the highest capital per worker and highest income per worker?
Cayman Islands, maybe? Or Vatican City?
Not linear … y = x ^ r where r is the slope of the line.
Bill Drissel
Grand Prairie, TX
@Bill
r is not the slope, but the rise/run.
@nobody.really: I assume chart income is pre-tax, in which case including the services the taxes fund as an income benefit would seem like double-counting. If after-tax you have a fair point.
I don’t think workers owning capital is to the point; 1) per Coase that’s inefficient, and 2) more capital at the firm raises the workers’ MRP without their having to incur those costs. (We are assuming they’re actually being paid for their efforts.) I’m not sure it’s even possible to measure median levels of capital? (As I recall at one time “the other” Cambridge was arguing we can’t really measure capital at all.)
“r is not the slope, but the rise/run.”
My eyes! My eyes!
Dave:
Printing money sends a false signal to the market that there is more capital available than there actually is.
Surely this can be true only if people are unaware of the monetary expansion.
Dave:
Printing money sends a false signal to the market that there is more capital available than there actually is.
Surely this can be true only if people are unaware of the monetary expansion.
“…you’ve got to be the sort of country where capital is worth accumulating.”
Like one that has a healthy respect for property rights? Grasshoppers and ants.
“To move up this ladder, you need to do more than just accumulate capital — you’ve got to be the sort of country where capital is worth accumulating.”
mmmm, property rights.
“Surely this can be true only if people are unaware of the monetary expansion.”
Nope. Look at Zimbabwe, the shelves were bare, despite the monetary expansion being scheduled well ahead of time and on a known published schedule. Excessive monetary expansion increases the relative usefulness of non-money items for wealth storage. In in the case of the US in the last 5 years, this explains commodity prices. In Zimbabwe, the expansion was so bad, that it began to affect perishable goods like bread.
@Doc Merlin:
I don’t see, in this particular case, how the bare shelves send a signal to the market about how much capital there really is.
“Surely this can be true only if people are unaware of the monetary expansion.”
At a guess not 95% of the population would know what monetary expansion is, how it affects them, how it affects the economy, or what are the other consequences of the expansion.
They probably don’t even care because all they know is that they are getting plenty of cheap money via debt thrown at them so now would be a good time to shop.
I would hazard (another) guess that if monetary expansion was distributed equally and everyone had full knowledge of its consequences, there would be no such thing as a business cycle.
Not linear … y = x ^ r where r is the slope of the line.
@Bill Drissel: Yes, but from just eyeballing the graph one can see r is very close to 1 which would make this a linear relationship on a linear (non-log) graph as well.
@Dave — a rationality red herring? Perhaps even people who don’t visit TBQ can recognize prices rising as they go out to bid for stuff. I presume anyone about to build something that calls for 100 bricks will verify they can actually procure 100 bricks. So still doesn’t seem like a big factor.
There would probably still be productivity shocks, oil shocks, and maybe even the occasional wave of animal spirits. But it certainly seems in practice monetary policy has been a source of instability…at this point even one bubble begetting the next.
iceman: the whole brick thing was a metaphor. Banks fund 30 year infrastructure projects with 5 year money for example.
Prof. Landsburg,
I am not sure that your reply to Dave is quite right. “Sending a signal that …” just means, “makes it profitable to act as if …”. If the government subsidized apple consumption and taxed orange consumption, consumers would buy more apples and fewer oranges. This would “send a signal” to farmers to produce more apples and fewer oranges, even when they know about the subsidy and tax. From the farmers’ point of view, the government has created a situation which is just the same as if untaxed and unsubsidized consumer preferences had changed. But, of course, they haven’t. So the tax and subsidy are perverting the allocation of resources between apples and oranges. Similarly, central banks’ meddling with interest rates perverts the allocation of resources between current consumption and saving, even when people know what the central bank is doing.
Sokona: You are correct insofar as the central bank can actually change the real interest rate, which it can do only insofar as prices are inflexible. I was imagining a world of flexible prices, where monetary expansion affects only prices and not interest rates. You’re probably right that (at least in the short run) the real world differs from my imaginary world in important ways.
Sokona: You are correct insofar as the central bank can actually change the real interest rate, which it can do only insofar as prices are inflexible. I was imagining a world of flexible prices, where monetary expansion affects only prices and not interest rates. You’re probably right that (at least in the short run) the real world differs from my imaginary world in important ways.
@ Brian
I won’t resort to my devastating humor this time — Ken B. may never see again — so here it is…
The relationship is linear. The slope doesn’t have to be 1. It doesn’t matter what the slope is as long as it is constant. I think Bill Dressel’s mistake was that he didn’t realize that BOTH axises are using logarithmic scale (albeit a bit screwed up).
The relationship is linear. The slope doesn’t have to be 1. It doesn’t matter what the slope is as long as it is constant.
@ Scott H: It definitely matters what the slope is. If you plot y=x^3 in log-log you get a straight line with a constant slope of 3.
Doc,
Look at Zimbabwe
Zimbabwe in no way negates what Steve has said about inflation. If the only reason the shelves are bear is the money supply expansion, this might be a good example. But as you noted even before your Zimbabwe example, property rights matter. How strong are property rights in Zimbabwe? Having a murderous dictator doesn’t help either.
That lack of property rights and having a murderous dictator are far more responsible for empty shelves than inflation.
The blog “Why Nations Fail” : whynationsfail.com has some fascinating posts on this topic… in summary, they assert :
* it’s politics, not economics, that decide whether nations grow or fail
* specifically, it’s the presence of what they call “extractive institutions” – political structures that enrich the powerful at the expense of the powerless.
re : log-log graphs :
If log(y) = m log(x) + c, then y=A.x^B, where A=b^c, B=b^m, and b is the base of the logarithm.
Translation into English : a linear fit on the log-log graph means the variables are related via a power law.
@Brian
OK, yes fair enough, but when I think linear I go back to y=x*r. In spite of the graph scale there is no logarithmic slope going on here.
Dave – so bank loan officers are among the 95% that don’t know what monetary expansion is? And are there lots of projects that take 30 years to *build*, or are you referring to their useful life?
Mike H – I have little doubt that’s correct. I saw Arrow once speaking about how puzzled economists were about the lack of growth in Africa. Seemed to me political corruption/dysfunction (e.g. lack of property rights) was a simple answer.
Iceman:
1) yes
2) yes
(A good rule of thumb is that workers are paid about 2/3 the value of what they produce.)
Steve Landsburg, Marxist.
Dave:
1) makes little sense to me
2) makes even less sense to me
iceman:
1) more broadly they don’t understand the effects
2) banks lend money for 30 years for a toll road. banks borrow money 5 years at a time and roll the borrowings. They presume that they will be able to roll the cash. Sometimes they can’t
both of these should be fairly visible given the events over the last 30 years
Also – re 1) they are paid to write loans so even in the off chance that they understand business cycle effects of monetary expansion, they either write the loans or they find a new career. Adverse selection.
“Steve Landsburg, Marxist.”
That’s what struck me, too. Isn’t the “rule of thumb” just the labor theory of value?
It’s been a while, but if I remember correctly, Modigliani showed that the relationship between savings rates and long term growth were quite robust. And he did that, what, 25 years ago? Maybe more. So for me, it’s not new to see very similar evidence.
Unless I’m missing something….which happens sometimes.
Mike H:
You have a mistake. In your notation, B = m, not b^m
Then, if m = 1 (which looks approximately true from eyeballing the graph), you have y = A x , so the relationship appears to be approximately linear, even if it were not plotted on a log-log graph
Bob Murphy: Ha! But of course if the company is putting up the capital and taking the risk, doesn’t that seem like a pretty fair split?
Advo: I see no evidence about inequality vs. growth in your link, just speculation. I did see evidence that rising inequality has not hurt (or helped) the poor.
Q – do you think the source of the inequality matters, e.g. a corrupt kleptocracy vs. a system where outcomes reflect productive contribution? Perhaps not all inequality is equal.
Dave – I agree that cheap $ if anything lowers our productivity (and loan officers will try to loan $ – except maybe today), but I don’t see the cause as over-investment in (later abandoned) capital projects. Rather the loss comes from people being incented to consume now or look for alternative, non-productive stores of value. In the housing boom it was real estate. Today maybe commodities (including EM funds as a proxy). Maybe it’s just the running out of bricks thing that’s not working for me. Houses take a few months to build, toll roads maybe a couple years (and are typically financed with muni bonds). Frankly I’m trying to imagine a type of project that would take much longer to complete that wouldn’t involve management by the same govt printing the $. Yes banks play the yield curve but that’s always the case.
@JohnW you are right. My bad.
That’s what struck me, too. Isn’t the “rule of thumb” just the labor theory of value?
There’s a universe of difference between saying “the value of goods is defined as the value of the input labor” and saying “empirically, input labor ends up recompensed, on average, 2/3 of the value of the good produced”
We haven’t had “real” capitalism in this country for eons…To make believe we have is totally inaccurate and untruthful. We’ve had capital cronyism where companies lobby for monopoly powers and subsidies from the taxpayer. Even huge profitable companies (oil and drug) get taxpayer money.
Mike H:
There’s a universe of difference between saying “the value of goods is defined as the value of the input labor” and saying “empirically, input labor ends up recompensed, on average, 2/3 of the value of the good produced”
Thanks for saying this, so I didn’t have to.
Advo, do you have evidence supporting the assertion/assumption that the problem of wealth accumulating in a few hands – which problem is the offered justification for the estate tax – actually exists in the absence of primogeniture laws and other such forms of government coercion?
I can cite evidence that the estate tax itself is a cause of wealth coming to be concentrated in a small number of hands. Those hands happen to be corporate boards and CEOs rather than families, and the single greatest example of this in the US is Warren Buffett of Berkshire Hathaway – one of the most prominent defenders of the estate tax as a tool for preventing the concentration of wealth.
Interesting graph and discussion.
I agree with Seth that the respect for property rights has to be a factor.
To be fair Steve, shouldn’t we give a head-nod to the Lucas paradox? If we were to get an alternative picture on what is going on in the poorest countries in the world, modeling real income per capita as a percentage of the U.S. to percentage growth rate in real income per capita, we would see no correlation between real income per capita and growth rates.
Stephen Williamson seems to acknowledge the possible reasons for why poor countries are still so poor in his textbook. He says it might be due to the activities of native workers who prevent technology from quickly being adapted in their country – “Burn the printing presses because they destroy jobs!”
This doesn’t explain the East-Asian growth miracle though. Stephen suspects that the growth in Japan, South Korea, etc. is more due to a more efficient allocation of resources instead of a stronger TFP.
‘Forgo that car purchase and the factories will produce another tractor instead. That’s why tax policies matter. A tax that punishes saving (e.g. the estate tax) is a tax that encourages spending.’
The trouble with this argument is that it could be used to justify rationing of consumption goods by non-price means.
Furthermore, since individuals experience more uncertainty than collectives, Estates are likely to hold more nominal than real assets than would be the case if savings were collectivized and risk pooling made mandatory.
My feeling is that this sort of thinking, in ‘Green’ disguise is gaining currency amongst the young.
@Warrl [Edited] “Do you have evidence supporting the assertion that the problem of wealth accumulating in a few hands … actually exists in the absence of … government [intervention]?”
I read one article showing how it is inevitable that wealth ends up accumulating in one person’s hands, unless there is some form of redistribution. The article modelled an economy as a bunch of individuals whose wealth follows a random walk – or more accurately, whose log(wealth) follows a random walk. Inevitably, just by chance, there ends up being some winners and some losers. Inevitably, in fact, one of the winners ends up so far ahead of the others that they have 99.99999% of all the wealth.
Don’t believe it? Try this experiment.
1) Let A=1000, B=1000, C=1000.
2) Toss three coins –
i) if the first is heads, multiply A by 1.1, otherwise divide it by 1.1.
ii) if the second is heads, multiply B by 1.1, otherwise divide it by 1.1.
iii) if the third is heads, multiply C by 1.1, otherwise divide it by 1.1.
3) divide each of A,B,C by (A+B+C)/3000 so the total wealth remains 3000. Or don’t. It’s up to you.
4) go to step 2.
After 100 loops through this, there’s a 2/3 chance that someone has more than the other two combined. The chance that they have five times as much as the others (combined) is about 1/20.
after 1000 loops, these probabilities change to 95% and 55%, and after 10000 loops, to 99% and 85%.
The accumulation of wealth is a natural mathematical consequence of the fact that money can be invested to derive income. It’s not caused by government intervention. In fact, if government intervention takes the form of redistribution from rich to poor, it will lessen the degree of accumulation from rich to poor. If, in the above simulation, I take 1 cent each step from the richest and give it to the poorest, the probability of someone holding 5 times the wealth of the others after 10000 steps changes from 6/7 to 2/3. Redistributing a dollar each step makes it 1/4.
Just as a note, the evidence to theory runs the other way. The reason we use Cobb-Douglas is because it generates constant factor shares.
“You are correct insofar as the central bank can actually change the real interest rate, which it can do only insofar as prices are inflexible.”
I do not agree there. Even with perfectly flexible prices there are models that lead to central bank money supply changes having real short term effects (Hayek’s Model for example). This only works where there are few close substitutes for the central bank’s money (like in our world where non-state money is illegal.)
Actually, I take that back, even with many close substitutes, its possible, you just get strange effects a lot faster.
Mike H – If the model you promote used accurate assumptions, there should be a winner. Who is it?
NC Lawyer – My take on why the real world doesn’t seem to square with Mike H’s game (e.g. David Friedman once estimated an upper limit of 5% to the share of natl income attributable to ‘original appropriation’ of unimproved land and resources) is that there is an earlier (or concurrent) set of loops called ‘capital accumulation’ with probabilities and payoff profiles that are much more dynamic and determinative of who ends up with what. And if wealth in that game is created primarily by providing people with things they value, then *we all win* i.e. don’t reset to $3 after each loop. We can try to redistribute but each time people will recreate the prevailing pattern (certainly over 100+ loops) again through voluntary exchange (Nozick called this the Wilt Chamberlain argument). Cranking the takings up to $1 per round will end this part of the game and fix total wealth at $3.
Dan, Salim, and Lucus hit the nail on the head.
A simple way of expressing this is, there are two different types of efficiency. “Good efficiency” is the type of efficiency which all economic growth is based on – workers outputting more goods or services with less time investment. “Bad efficiency” is efficiency based on workers being able to claim a smaller percentage of the output they produce. Like bad Cholesterol, this is not bad in moderation. In fact, for an economy to function well, you have to have investment in the means of producing more, or producing more efficiently, and this comes from profits, which among other things is an excess over worker wages. However, in order to produce and sell new things, you have to have people being able to buy those new things as well, so by definition, expansion in capital (the means of production) requires expansion in consumptive ability (the means of accessing said production). In fact, when you realize that the value of capital is based on consumption associated with it rather than being based on the expenses that went into it, you realize the graph above does not fall that short of being a tautological graph.
Vic – I think land is another result rather than a cause, although to a certain extent, asset price increase is a subtle way of feeding consumption, so it would be causal in that sense.
Dave: The business cycle will exist as long as the capital valuation cycle exists. Remember that wages only pay for part of Revenue. The only way Revenue doesn’t shrink is if you continually reallocate dollars related to assets and dollars that would be savings back into consumption or dollars that wouldn’t exist if it weren’t for inflation back into consumption. In other words, assuming Revenue equilibrium:
Revenue = (wages from revenue) + (constant consumption desire of the wealthy) + (proportion of Asset growth attributable to the consumption class) + (proportion of inflation attributable to the consumption class) + (tax based redistribution)
Actually adjustment to the above needs to be made for imports and exports. Based on the above, a third world country has additional challenges because asset growth among consumers is minimal and the only solutions are to either try to export their way out of problems or keep tax and inflation higher than wages.
Note that by inflation I mean monetary inflation, rather than price inflation. Consumer price inflation only occurs when money grows faster than output or when prices are increased outside the closed system, possibly by resource shortages (in the economic system, but exterior to the monetary cycle system) or by imports increasing in price.
Bob – Actually, US workers would be thrilled to be paid 2/3 of what they produce. In actuality, median wages (or average wages for the bottom 80% or so) have grown little since 1970. Meanwhile, productivity has grown by about 50% over the same time period. This means if Say’s law was relevant to the modern economy, the average person making $50,000 a year would be making $75,000 a year.
http://bit.ly/sOOfKq
Hondo – IMO, another way of saying this that will resonate better is, pure Adam Smith capitalism, which was created as a better alternative to feudalism, has different math associated with it than the current system which is kind of a cross between Feudalism and Adam Smith-style capitalism. This is not to say that the current system doesn’t have any advantages over pure capitalism; it just means you have to throw out some of the math and redo it if you would understand the system.
Warrl – Um …
http://bit.ly/sb9jAh
http://bit.ly/rv6OaU
http://bit.ly/v1CJ7P
Mike H – Rather than random chance, we can talk about wealth accumulation by specific design. For example if a professional poker player sits down at a friendly poker game it will cease to be fun after a couple hours. Of course, the big difference is the professional poker player doesn’t have to contribute to the group to win. I would argue that capitalism works best when contribution to society is the most effective way of winning and it ceases to work when accumulating negotiating leverage and asymmetric information is the most effective way of increasing wealth. The latter condition has a great resemblance to the poker game.